🟦 KPI: Utilization Rate – Performance Dashboard for Service Teams
A ready-to-use system for tracking your team’s billable time and efficiency – built for service businesses.
Built in Coda.io – fully functional in 15 minutes. No coding. No setup. No hassle.
📌 You’ve got a great team – but how much of their time is really productive?
If your business runs without clear data on how time is spent across projects, this tool is for you.
KPI: Utilization Rate is a lightweight analytics system that helps you:
-
measure how much of your team’s time goes into billable work,
-
compare performance across people and teams month to month,
-
react early when efficiency drops,
-
make staffing and operational decisions based on real numbers.
✅ What’s included?
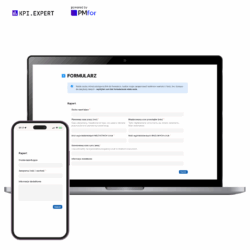
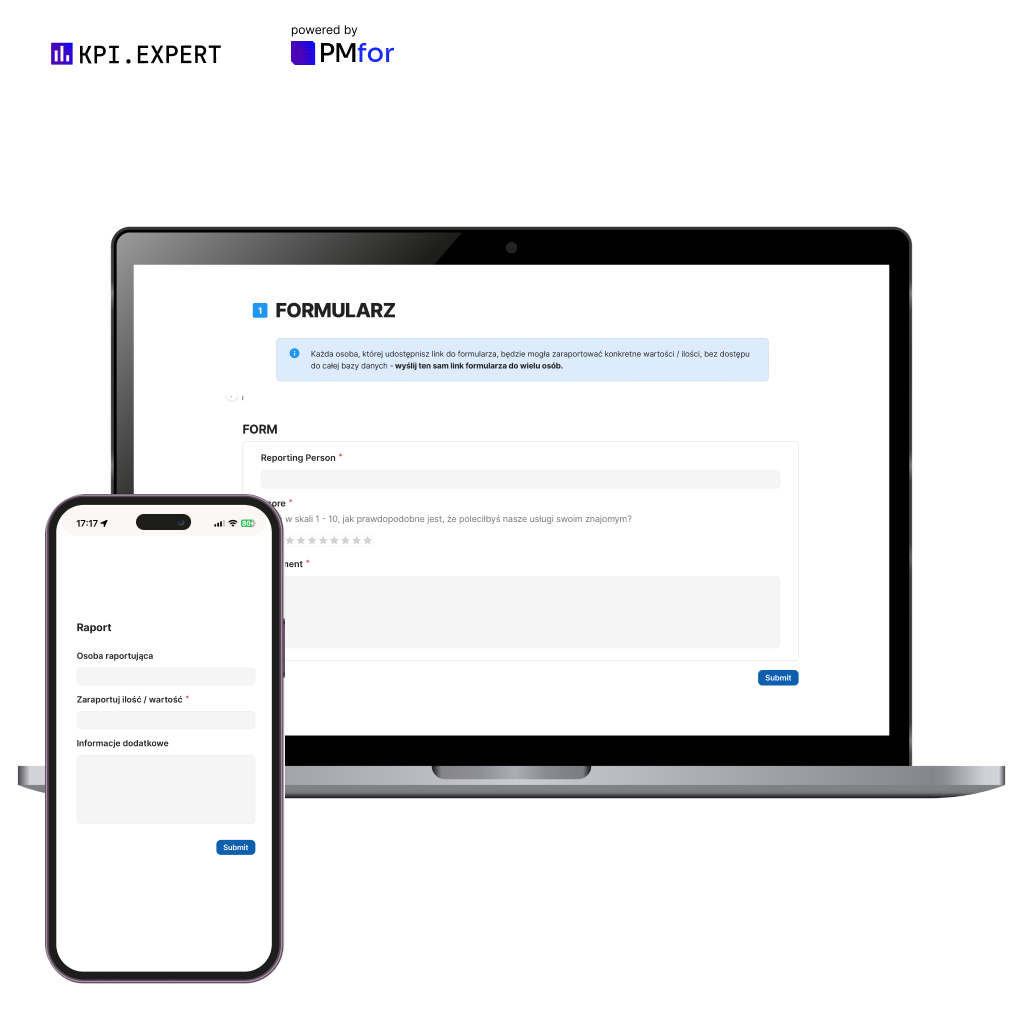
1. Data Entry Form
Share one monthly reporting link with your team – works on desktop or mobile, no login needed:
-
enter available hours and billable/project hours
-
submit in under a minute
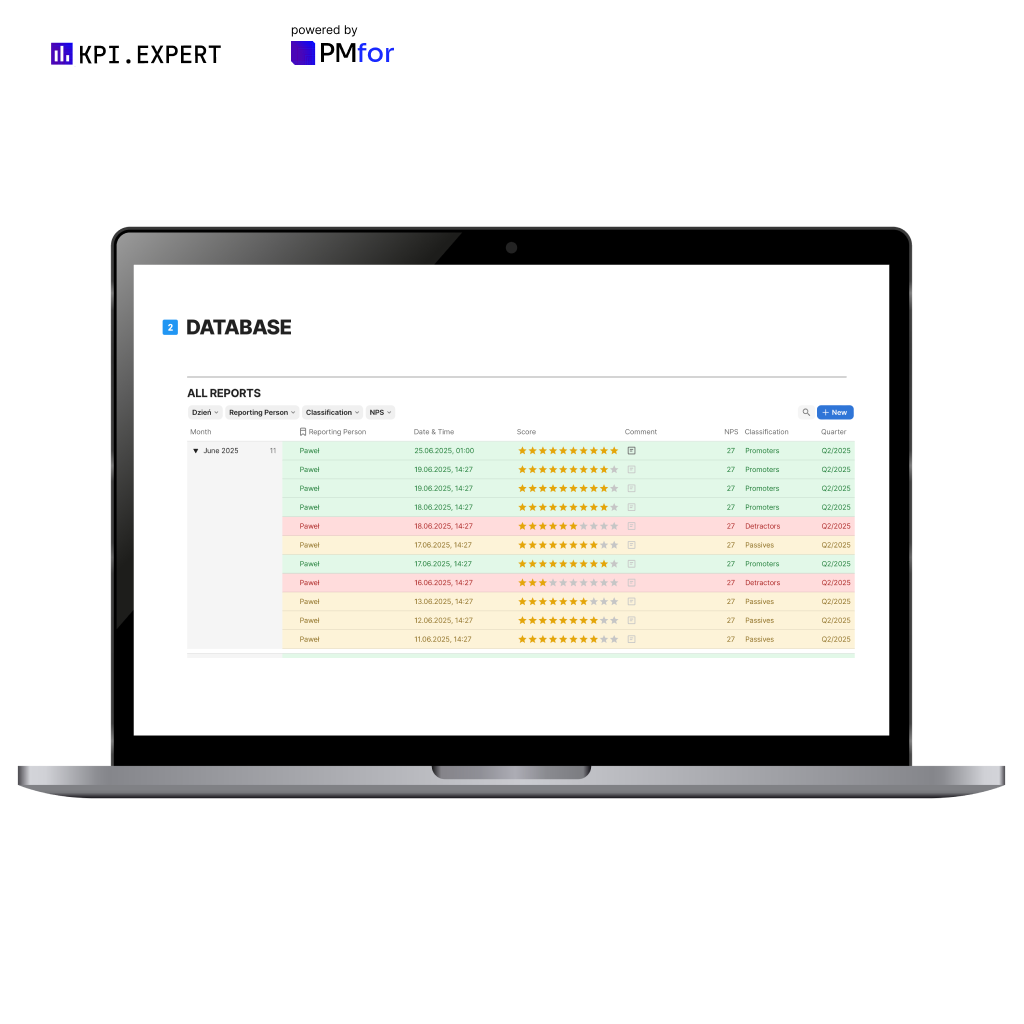
2. Centralized Reporting Database
All data goes into one place:
-
automatic KPI calculations per person
-
month-over-month performance history
-
filter by team, person, or time period
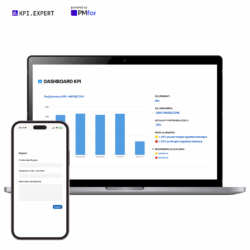
3. KPI Dashboard
A manager’s visual dashboard to track and act on trends:
-
current and historical utilization rates
-
team benchmarks and efficiency goals
-
comparisons between team members
🎯 Why track utilization rate?
Without this KPI, you don’t really know how much value your team delivers.
Utilization Rate helps you:
-
spot underused resources,
-
make smarter hiring and sales decisions,
-
keep margins strong even as your team grows.
📚 Want to learn more before you buy?
Check out our blog post explaining:
-
how to calculate utilization rate
-
industry benchmarks and warning levels
-
what to do when the number drops
👉 📊 Read: KPI: Utilization Rate – What It Is, How to Calculate It, and What to Do When It Drops
💡 Who is this tool for?
✅ Creative agencies, software companies, and consulting teams
✅ Managers and team leads who want visibility into productivity
✅ Business owners who want to scale based on real data
🧾 What you get after purchase:
-
A shareable link to your ready-to-use KPI system in Coda.io
-
Step-by-step setup instructions
-
Immediate access and deployment
-
A dashboard you can customize or connect with other KPIs
❓ FAQ
Do I need to know how to use Coda.io?
No – it’s ready to use with a simple guide. Just open it in your browser.
Can I start manually and switch to API later?
Yes – you can enter data by hand now and automate it later via your time tracking tools.
Does it work on mobile?
Yes – both the forms and dashboard work in any mobile browser.
How many users can report data?
Unlimited – just share the link with your team.
🚀 Ready to get started?
Buy now and take control of your team’s real performance – see what work actually creates value.